# Chart Visualization Agent Skills
> Transform complex datasets into intuitive visual charts with AntV Chart Visualization Skills, offering 26+ chart types and AI-powered generation. Start creating impactful data stories effortlessly.
- Canonical: https://nanoskill.ai/skills/chart-visualization-skills
- Markdown: https://nanoskill.ai/skills/chart-visualization-skills.md
- Author: antvis
- Published: 2026-06-09T05:00:00.000Z
- Updated: 2026-07-25T04:33:38.870Z
- Language: en
- Source type: github
- Popularity signal: 523
## Sources
- https://github.com/antvis/chart-visualization-skills
## Install
```shell
npx skills add https://github.com/antvis/chart-visualization-skills
```
## About
AntV Chart Visualization Skills offer a professional suite of visualization solutions designed to transform complex datasets into intuitive visual charts efficiently and accurately. Initiated by Ant Group, this collection of skills empowers users to navigate the entire workflow from chart design and interactive exploration to in-depth data analysis, significantly lowering the barrier to creation through intelligent design specifications and a rich library of components. It provides robust support for daily reporting, dynamic dashboards, and sophisticated interactive analysis, making data visible and understandable.
The suite includes specialized skills like "chart-visualization" for generating 26+ chart types, "infographic-creator" for transforming text into engaging visual infographics with 50+ templates, and "narrative-text-visualization" for converting unstructured data into semantically rich reports using T8 Syntax. These capabilities are further enhanced by AI integration, streamlining and automating the generation and optimization of visualizations, allowing analysts to focus more on uncovering insights and driving business decisions.
Developers can also leverage dedicated skills such as "antv-s2-expert" for multi-dimensional cross-analysis tables, "antv-g6-graph" for generating G6 v5 graph visualizations, and "antv-g2-chart" for creating G2 v5 statistical charts. These tools provide accurate, runnable code following best practices, covering core functionalities, various layout algorithms, component types, and interactions. The skills can be integrated into Node.js projects via CLI or API, offering flexibility for different development needs.
## Key features
- **Comprehensive Chart Generation**: Access 26+ intelligent chart types for diverse data visualization needs, including time series, comparisons, relationships, and geographic data.
- **AI-Powered Infographic Creation**: Generate beautiful infographics from text content using 50+ templates, transforming information into perceptible visual language with intuitive symbols.
- **Structured Narrative Text Visualizations**: Convert unstructured data into semantically rich narrative reports using T8 Syntax, a Markdown-like language for data narratives with entity annotations and mini charts.
- **Multi-Dimensional Cross-Analysis Tables**: Utilize the AntV S2 Expert for developing pivot tables, table sheets, and custom cells, offering comprehensive guidance for multi-dimensional data analysis.
- **Advanced Graph and Statistical Chart Generation**: Generate accurate G6 graph code for network, tree, and flow charts, and G2 chart code for statistical visualizations like bar, line, and pie charts, following best practices.
## Use cases
- **Create Daily Reports and Dynamic Dashboards**: Quickly transform complex datasets into intuitive visual charts for daily reporting and dynamic dashboards, enabling efficient data-driven decision-making.
- **Develop Sophisticated Interactive Analysis Tools**: Leverage AntV's robust toolkit to build advanced interactive analysis applications, providing in-depth data exploration and visualization capabilities.
- **Generate AI-Optimized Visualizations**: Streamline and automate the generation and optimization of data visualizations with integrated AI capabilities, allowing analysts to focus on insights.
- **Transform Data into Engaging Infographics**: Convert data, information, and knowledge into visually appealing infographics using a variety of templates to communicate complex ideas clearly and memorably.
## Result preview
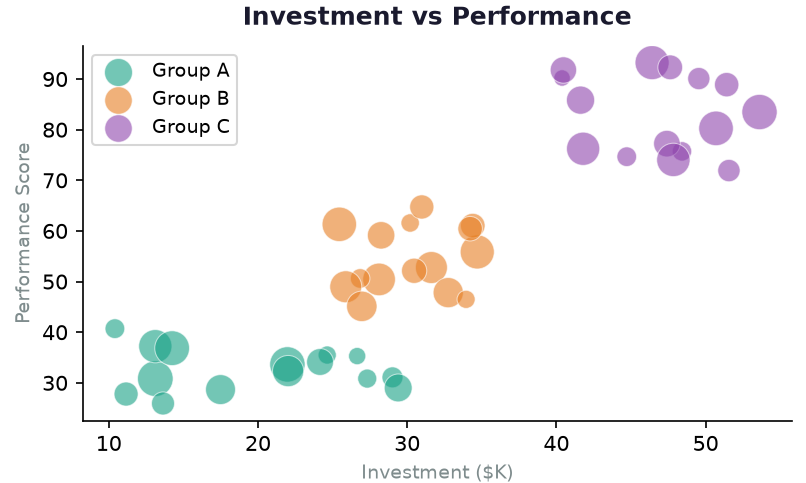
Explore a professional AI-powered data visualization report powered by this Skill.


## Result walkthrough
### Install
Add the AntV Chart Visualization Skill to your AI agent.

### Describe
Describe the topic area you want visualized, including objectives, target audience, and preferred chart types or styles.

### Optimize Visualizations
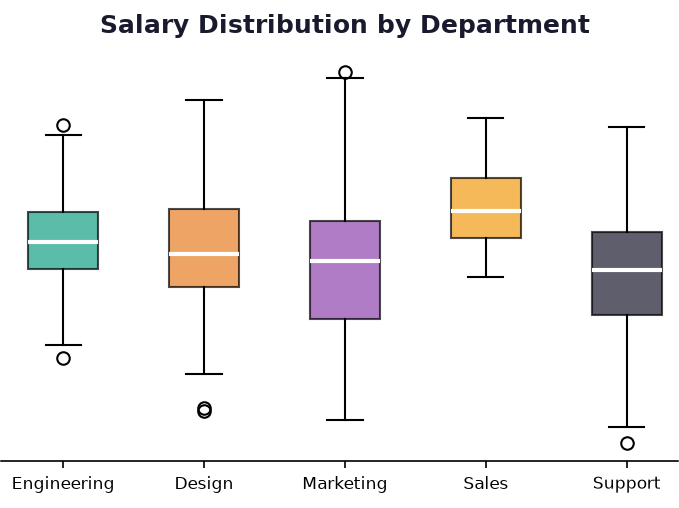
The Skill generates charts and dashboards optimized for clarity, layout, and insights.
## Skill definition
# Chart Visualization Skills
Turning data into a visual language for better thinking.
## Overview
In the era of data-driven decision-making, efficient and accurate data visualization and analysis are paramount. AntV offers a professional suite of visualization solutions, providing a robust toolkit and a comprehensive set of skills for the entire workflow—from chart design and interactive exploration to in-depth data analysis. It empowers users to swiftly transform complex datasets into intuitive visual charts, significantly lowering the barrier to creation through intelligent design specifications and a rich library of components. Whether for daily reporting, dynamic dashboards, or sophisticated interactive analysis, AntV delivers reliable support. By integrating AI capabilities, these tools further streamline and automate the generation and optimization of visualizations. This allows analysts to focus more on uncovering insights and driving business decisions, truly making data visible and understandable.
> [!WARNING]
> This project only merges AI-generated code.
>
> **How to contribute:**
> 1. Submit an issue describing the problem clearly
> 2. Assign it to @copilot with your requirements
## Usage
Add this marketplace to Claude Code:
```bash
/plugin marketplace add antvis/chart-visualization-skills
```
Or you can directly install the skills for your multiple agents:
```bash
npx skills add antvis/chart-visualization-skills
```
## Available Skills
- 📊 **chart-visualization**: A comprehensive chart generation skill powered by AntV that provides 26+ chart types for intelligent data visualization.
`Chart Visualization` intelligently selects the most appropriate chart type from 26+ available options, extracts parameters based on detailed specifications, and generates high-quality chart images. It covers time series, comparisons, part-to-whole, relationships, geographic, hierarchical, statistical, and specialized visualizations.
- 🎨 **infographic-creator**: Create beautiful infographics based on given text content. Use when users request to create infographics.
`Infographic Creator` uses AntV Infographic to transform data, information, and knowledge into a perceptible visual language. It combines visual design with data visualization, providing 50+ templates including lists, sequences, hierarchies, comparisons, relations, and charts. It compresses complex information with intuitive symbols to help audiences quickly understand and remember key points.
- 🖼️ **icon-retrieval**: Search and retrieve icon SVG strings from icon library. Returns up to 5 matching icons by default (customizable).
`Icon Search` helps users find appropriate icons for various use cases including infographics, web development, design, and more. Search by keywords to discover available icons and retrieve their SVG strings directly. Each search returns up to 5 matching icons by default (customizable via topK parameter) with their URLs and complete SVG content.
- 📝 **narrative-text-visualization**: Generate structured narrative text visualizations from data using T8 Syntax.
`Narrative Text Visualization` (T8) transforms unstructured data into semantically rich narrative reports using T8 Syntax - a declarative Markdown-like language for creating data narratives with entity annotations. It's LLM-friendly and framework-agnostic, working seamlessly with HTML, React, and Vue. Perfect for creating data analysis reports, summaries, and insights documents with entities like metrics, values, trends, and dimensions properly labeled. Features include built-in mini charts, standardized styling, and professional formatting. Supports authentic data sources and provides lightweight, technology-agnostic rendering.
- 📋 **antv-s2-expert**: S2 multi-dimensional cross-analysis table development assistant. Use when users need help with S2 pivot tables, table sheets, or any @antv/s2 related development.
`AntV S2 Expert` helps users develop with the S2 multi-dimensional cross-analysis table engine. It provides comprehensive guidance on `@antv/s2` core engine, `@antv/s2-react` and `@antv/s2-vue` framework bindings, `@antv/s2-react-components` advanced analysis components, and `@antv/s2-ssr` server-side rendering. Covers pivot tables, table sheets, custom cells, theming, events, interactions, sorting, totals, tooltips, frozen rows/columns, icons, pagination, and more.
- 🕸️ **antv-g6-graph**: G6 v5 graph visualization code generator. Use when users need to generate G6 graphs — network graphs, tree graphs, flow charts, mind maps, and any relational or graph-structured data visualization with the G6 library.
`AntV G6 Graph` generates accurate, runnable G6 v5 code following best practices. It covers core graph initialization, data structures (nodes, edges, combos), 10+ layout algorithms (force, dagre, circular, grid, mindmap, fishbone, etc.), all built-in node/edge/combo types, state management, 15+ behaviors (drag-canvas, zoom-canvas, click-select, lasso, etc.), 10+ plugins (minimap, tooltip, toolbar, legend, timebar, etc.), custom element development, transforms, and animation. Built-in guard rails prevent common v4→v5 migration pitfalls such as using deprecated `G6.Graph()` constructors, `graph.data()` APIs, or Mode-based behavior configuration.
- 📈 **antv-g2-chart**: G2 v5 chart code generator. Use when users need to generate G2 charts — bar charts, line charts, pie charts, scatter plots, area charts, heatmaps, and any statistical data visualization with the G2 library.
`AntV G2 Chart` generates accurate, runnable G2 v5 code following Spec Mode best practices. It covers 30+ chart types (interval, line, area, point, rect, cell, treemap, sankey, chord, wordCloud, gauge, and more), data transforms (stackY, dodgeX, binX, fold, etc.), coordinate systems (cartesian, polar, theta, radial), scales, interactions (brush, slider, legend filter), components (axis, legend, tooltip, annotation), and multi-view compositions. Built-in guard rails prevent common v4→v5 migration pitfalls such as using deprecated chain APIs, invalid palette names, or referencing `d3` in user code.
**Evaluation Results**
Harness Engineering approach has been rigorously tested against 174 chart generation test cases, demonstrating significant improvements over baseline methods:
| **Model** | **G2** | **G6** |
| :---: | :---: | :---: |
| qwen3-coder-480b-a35b-instruct | ✨ 98.2% +17.7% | 94.8% +15.6% |
| Kimi-K2.5 | 97.7% +17.2% | 96.9% +17.7% |
| GLM-5.1 | 93.6% +13.1% | 92.8% +13.6% |
| DeepSeek-V3.2 | 90.8% +10.3% | ✨ 97.9% +18.7% |
| Context7 Baseline | 80.5% | 79.2% |
The results show that Harness Engineering enables LLMs to achieve near-production-ready accuracy (up to 98.2%), significantly outperforming the Context7 baseline approach.
> [!TIP]
> More skills are coming soon.
## Library Usage
It can be used as a library in your Node.js projects with `CLI` and `API`.
### CLI Usage
We also provide a CLI tool named `antv` for easy usage in your terminal, Install globally:
```bash
npm install -g @antv/chart-visualization-skills
```
**Retrieve or list skills by query**:
```bash
# Retrieve skills by query (metadata only)
antv retrieve "bar chart" --library g2 --topk 10
# Retrieve skills with full markdown content (core constraints auto-prepended)
antv retrieve "bar chart" --library g2 --content
# Retrieve skills and output as JSON
antv retrieve "bar chart" --library g2 --output json
# Get a skill by its exact ID
antv get g2-mark-interval-basic --library g2
# List all available skills
antv list --library g2 --category core
# List skills and output as JSON
antv list --output json
# Show skill info (core constraints from SKILL.md)
antv info --library g2
# Show skill info as JSON
antv info --library g2 --output json
```
**Usage for the command**:
```
Usage: antv [options] [command]
CLI tool for AntV chart visualization skills retrieval
Options:
-V, --version output the version number
-h, --help display help for command
Commands:
retrieve [options] Search for skills matching a query
get [options] Get a skill by its exact ID
list [options] List all available skills
info [options] Show skill info from SKILL.md
help [command] display help for command
Options for retrieve:
--library Filter by library (e.g. g2, g6)
--topk Number of results to return (default: 7)
--content Include markdown content body in results; core constraints (SKILL.md Section 1-2) are always prepended as the first result
--output Output format: json | text (default: "text")
```
> Note: `--content` always prepends the library's core constraints (Section 1 & 2 of SKILL.md, up to the `` marker) as the first result, ensuring the model receives essential rules alongside the reference documents.
### API Usage
```typescript
import { retrieve } from '@antv/chart-visualization-skills';
// Metadata only (no content)
const skills = retrieve('bar chart', { library: 'g2', topK: 5 });
// With full markdown content (core constraints auto-prepended as first result)
const skills = retrieve('bar chart', { library: 'g2', topK: 5, content: true });
// With content but without core constraints
const skills = retrieve('bar chart', { library: 'g2', topK: 5, content: true, includeInfo: false });
```
```typescript
retrieve(query: string, options?: RetrieveOptions): Skill[]
interface RetrieveOptions {
library?: string; // Library filter, e.g. 'g2' or 'g6'
topK?: number; // Number of results (default: 7)
content?: boolean; // Include markdown content body (default: false)
includeInfo?: boolean; // Prepend SKILL.md core constraints (default: same as content)
}
```
| Option | Type | Default | Description |
| :--- | :--- | :--- | :--- |
| `library` | `string` | all | Library filter (`g2` or `g6`) |
| `topK` | `number` | `7` | Number of results |
| `content` | `boolean` | `false` | Include markdown content body |
| `includeInfo` | `boolean` | same as `content` | Prepend SKILL.md core constraints (Section 1-2) as first result |
> Notes:
> - Default retrieval returns lightweight result objects without the `content` field.
> - `content: true` returns markdown content body (frontmatter metadata is excluded).
> - When `includeInfo` is true (the default when `content: true`), the core constraints block — SKILL.md up to `` — is injected as the first element (id prefixed with `__info__`), ensuring the model always sees the essential rules.
```typescript
import { info } from '@antv/chart-visualization-skills';
const skillInfo = info('g2');
// => { name: 'antv-g2-chart', description: '...', content: '...', constraintsContent: '...' }
```
```typescript
info(library?: string): SkillInfo | undefined
interface SkillInfo {
name: string;
description: string;
content: string; // Full SKILL.md body (after frontmatter)
constraintsContent: string; // SKILL.md body up to marker; injected by retrieve when includeInfo: true
}
```
| Parameter | Type | Default | Description |
| :--- | :--- | :--- | :--- |
| `library` | `string` | `'g2'` | Library to get info for (`g2` or `g6`) |
## License
MIT License - see the [LICENSE](LICENSE) file for details.
## FAQ
### What are AntV Chart Visualization Skills?
AntV Chart Visualization Skills are a suite of tools and capabilities powered by AntV, designed to help users efficiently and accurately visualize and analyze data. They include features for chart generation, infographic creation, narrative text visualization, and specialized graph and statistical chart development.
### How many chart types does the chart-visualization skill support?
The chart-visualization skill provides 26+ chart types for intelligent data visualization, covering a wide range of data representations including time series, comparisons, relationships, and geographic data.
### Can I create infographics with these skills?
Yes, the infographic-creator skill allows you to create beautiful infographics based on given text content. It uses AntV Infographic and offers 50+ templates to transform data into a perceptible visual language.
### What is Narrative Text Visualization (T8 Syntax)?
Narrative Text Visualization (T8) transforms unstructured data into semantically rich narrative reports using T8 Syntax, a declarative Markdown-like language. It's designed for creating data narratives with entity annotations, mini charts, and professional formatting, suitable for analysis reports and insights documents.
### How do AntV Chart Visualization Skills help with multi-dimensional analysis?
The antv-s2-expert skill acts as a development assistant for the S2 multi-dimensional cross-analysis table engine. It provides comprehensive guidance for working with pivot tables, table sheets, custom cells, and various other features of @antv/s2.
### Are there tools for generating specific graph and statistical charts?
Yes, the antv-g6-graph skill generates G6 v5 code for graph visualizations like network graphs, tree graphs, and flow charts. The antv-g2-chart skill generates G2 v5 code for statistical charts such as bar charts, line charts, pie charts, and scatter plots, following best practices.