Best Excel Agent Skills: Spreadsheet Automation for Modern Workflows
Discover the best Excel agent skills for data analysis, spreadsheet automation, reporting, and workflow optimization across business use cases.
Why Excel Still Needs AI
Excel is still one of the most important business tools in the world.
But most people are still using it manually.
They spend hours:
- cleaning messy spreadsheets
- writing formulas
- fixing broken data
- building reports
- searching for the right functions

And despite all the advances in AI, Excel remains surprisingly time-consuming for millions of workers.
That’s why Excel agent skills are becoming one of the fastest-growing categories in AI productivity.
Instead of simply generating formulas, modern AI Excel agents can:
- analyze datasets
- automate repetitive workflows
- explain formulas
- clean data automatically
- build reports from natural language prompts
In other words: "AI is turning Excel from a manual spreadsheet tool into an intelligent data assistant."
In this article, we’ll explore the best Excel agent skills available right now — and which ones are actually useful for real productivity work.
What the Open Claw Excel Agent Can Actually Do
After testing, the Excel Agent Skill is capable of:
- Formula generation
- Data cleaning
- Report automation
- Dashboard creation
- Business analysis
- Exception monitoring
To evaluate its capabilities, I tested the skill across two increasingly complex levels of Excel work.
Level 1: Spreadsheet Automation
After installing the Excel Agent Skill, Open Claw can automatically transform raw spreadsheet data into structured business insights with almost no manual work.
In this example, the AI takes the original sample dataset and completes two practical Excel automation tasks in seconds.
Automated Quarter Categorization & Sales Rep Performance Summary
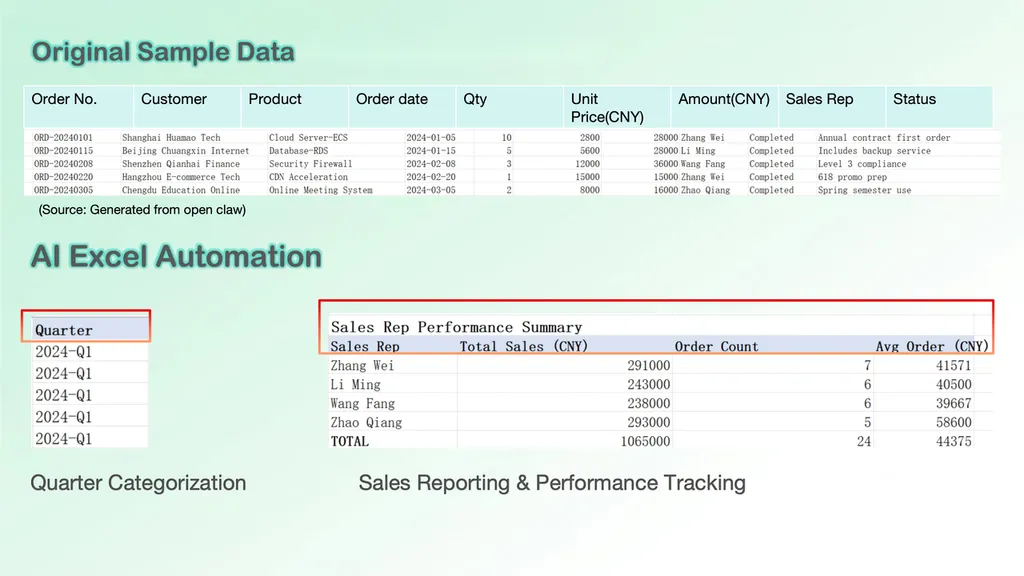
The first task is quarter classification.
Open Claw analyzes the order dates and automatically assigns each transaction to its corresponding fiscal quarter. Instead of manually sorting dates or writing formulas row by row, the AI generates a clean and standardized quarter column automatically.
For Excel users handling large datasets, this eliminates one of the most repetitive spreadsheet tasks.
The second task focuses on sales reporting automation.
Using built-in Excel formulas and aggregation logic, Open Claw creates a complete sales representative performance summary from the raw dataset.
The AI automatically calculates:
- total sales revenue
- order count
- average order value
Normally, this workflow would require multiple formulas such as:
- SUMIF
- COUNTIF
- average calculations
- manual range management
Instead, the Excel agent builds the reporting structure automatically from a natural language request.
The result is a lightweight analytics dashboard that converts raw spreadsheet records into actionable business insights.
Rather than spending time building formulas manually, users can focus on interpreting the data and making faster operational decisions.
In-Progress Order Tracking & Dynamic Order Extraction
Unlike spreadsheet AIs that simply generate completed Excel files, this Open Claw Excel agent acts more like an intelligent Excel architect.
Instead of replacing the user’s workflow entirely, it designs the logic behind the spreadsheet system and explains how everything works.
In this example, the user asks Open Claw to track all “In Progress” orders from a larger sales dataset.
Rather than generating a static table, the AI creates a complete Excel implementation plan, including:
- worksheet structure
- formula logic
- dynamic filtering methods
- reporting automation
- summary calculations
The workflow begins with an automated extraction system.
Open Claw identifies all rows where the order status equals “In Progress” and dynamically populates a dedicated tracking section.
To achieve this, the AI recommends combining two advanced Excel functions:
- AGGREGATE
- INDEX
This is a surprisingly strong approach because it mirrors techniques commonly used in professional Excel dashboards.
The logic works like this:
- AGGREGATE locates the nth matching row that satisfies the filtering condition
- INDEX retrieves the corresponding order data into the reporting table
Instead of manually filtering data every time new orders appear, the tracking sheet updates dynamically through formula-driven automation.
For intermediate Excel users, this is genuinely useful formula engineering rather than surface-level AI assistance.
Before vs After Optimization
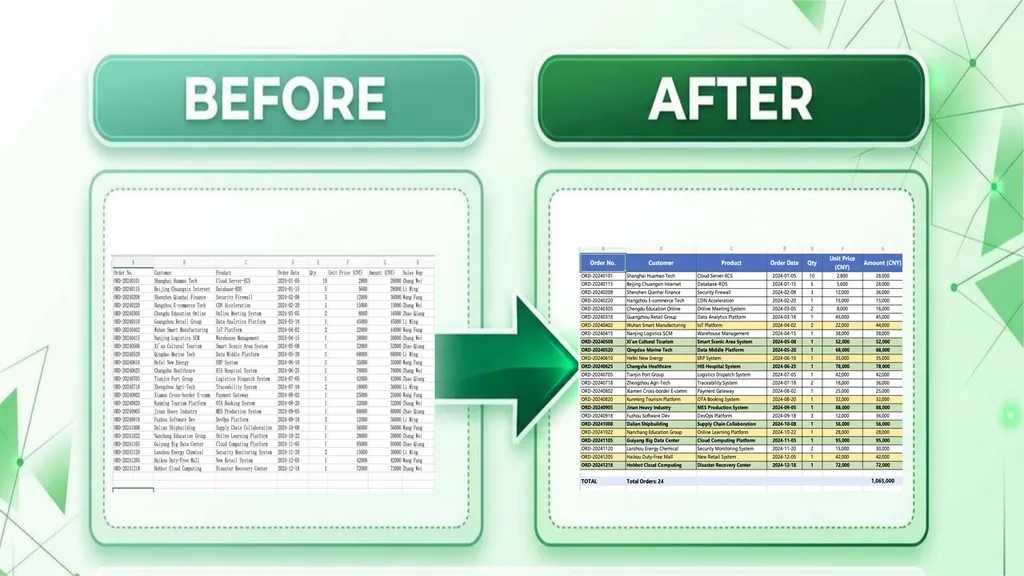
The original spreadsheet contains valuable sales data, including customers, products, order amounts, sales representatives, and order status. However, it functions mainly as a data repository. Important deals, in-progress orders, and high-value opportunities are mixed together, making analysis time-consuming.
After optimization, the Excel Agent transforms the worksheet into a more actionable reporting tool.
- Automated Highlighting
The AI applies conditional formatting to automatically emphasize:
- High-value transactions
- In-progress orders
- Strategic customers
- Important business notes
This allows users to spot critical records instantly instead of manually scanning every row.
- Better Order Tracking
Active orders are clearly visible and separated from completed transactions, making it easier for sales teams to monitor ongoing projects and customer follow-ups.
- Built-In Business Insights
The optimized spreadsheet includes summary metrics such as:
- Total Order Count
- Total Revenue
- Sales Performance Overview
Instead of manually calculating KPIs, users receive an immediate snapshot of business performance.
Why It Matters
The biggest improvement is that the spreadsheet shifts from simple data storage to decision support.
Before optimization:
- Data is organized but difficult to analyze.
- Important opportunities are easy to overlook.
- Reporting requires manual effort.
After optimization:
- Critical information is highlighted automatically.
- Business priorities become visible at a glance.
- Managers can make faster, data-driven decisions.
This example shows how an Excel Agent Skill can go beyond formula generation and help turn raw spreadsheet data into a lightweight business intelligence system.
Level 2: Business Intelligence & Analytics
Most AI Excel assistants can generate formulas. Far fewer can design complete analytical workflows.
To evaluate the practical capabilities of the Excel Agent Skill, I assigned it three business-oriented tasks that are commonly handled by sales operations, business analysts, and finance teams. The results demonstrate that the skill goes well beyond basic spreadsheet assistance and moves toward workflow automation.
Task 1: Building a Dynamic Sales Performance Dashboard
The first challenge was to create a reusable sales dashboard that could automatically refresh when new weekly data is added.

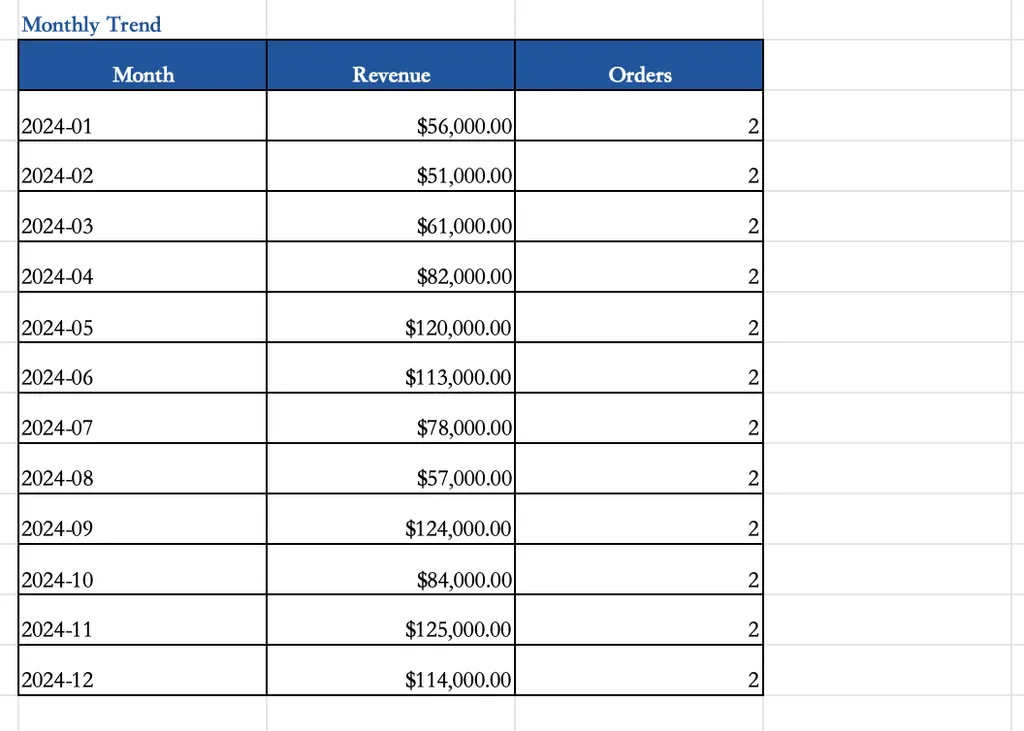
The dashboard requirements included:
- Weekly sales volume by representative
- Deal-stage distribution visualization
- Monthly sales trend tracking
- Automatic identification of top and bottom performers
Rather than generating isolated formulas, the Excel Agent designed an entire reporting framework. It recommended chart structures, aggregation logic, conditional formatting rules, and automated calculations that could continuously update as new records entered the dataset.
This significantly reduces the manual effort normally required to maintain weekly sales reports.
The most valuable aspect is that the dashboard is reusable. Once configured, users can simply import new weekly data and allow the reporting system to refresh automatically.
Task 2: Product Line and Regional Analysis
The second task focused on transforming raw transaction records into business intelligence insights.
The original dataset contained sales information distributed across multiple rows without any product-level aggregation. As a result, it was difficult to identify purchasing patterns across different markets.

The Excel Agent was asked to analyze four key regions:
- United States
- China
- United Kingdom
- Germany
Its objectives were to:
- Identify the most frequently purchased products in each region
- Compare Average Order Value (AOV) between markets
- Determine the strongest growth opportunity for future expansion
The AI proposed a structured aggregation approach that groups transactions by product and region before calculating performance metrics.
Instead of manually building PivotTables and comparison reports, users receive a clear framework for understanding regional purchasing behavior and revenue opportunities.
This type of analysis is particularly valuable for companies seeking to allocate sales resources more effectively and identify high-potential markets.
Task 3: Automated Anomaly Order Detection
The most advanced task involved building an exception monitoring system.
The Excel Agent was instructed to create a rule engine capable of automatically identifying suspicious orders and generating an exception report.
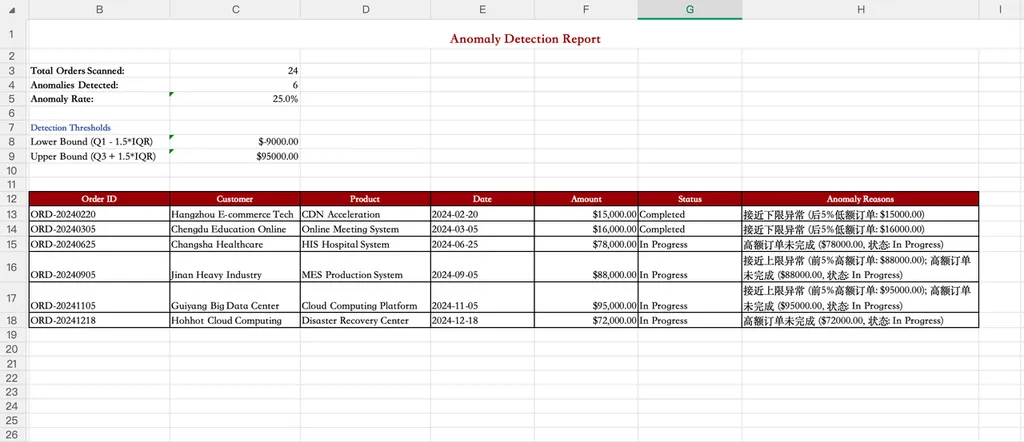
The detection framework included:
Outlier Detection
Orders with unusually high or unusually low transaction values are automatically flagged using statistical thresholds.
Duplicate Order Detection
The system identifies repeated purchases of the same product occurring on the same day, helping detect potential data-entry issues or duplicate transactions.
Invalid Amount Detection
Orders containing zero or negative values are automatically highlighted for review.
Keyword-Based Anomaly Detection
The AI also proposed pattern-matching rules that scan notes and remarks for suspicious keywords such as:
- "test"
- "delete"
- spam-related comments
Orders matching these conditions are flagged and categorized for investigation.
The final output is a structured Exception Order List containing both the flagged transaction and the corresponding reason code, allowing teams to review anomalies efficiently.
Top Excel Agent Skills Worth Exploring in 2026
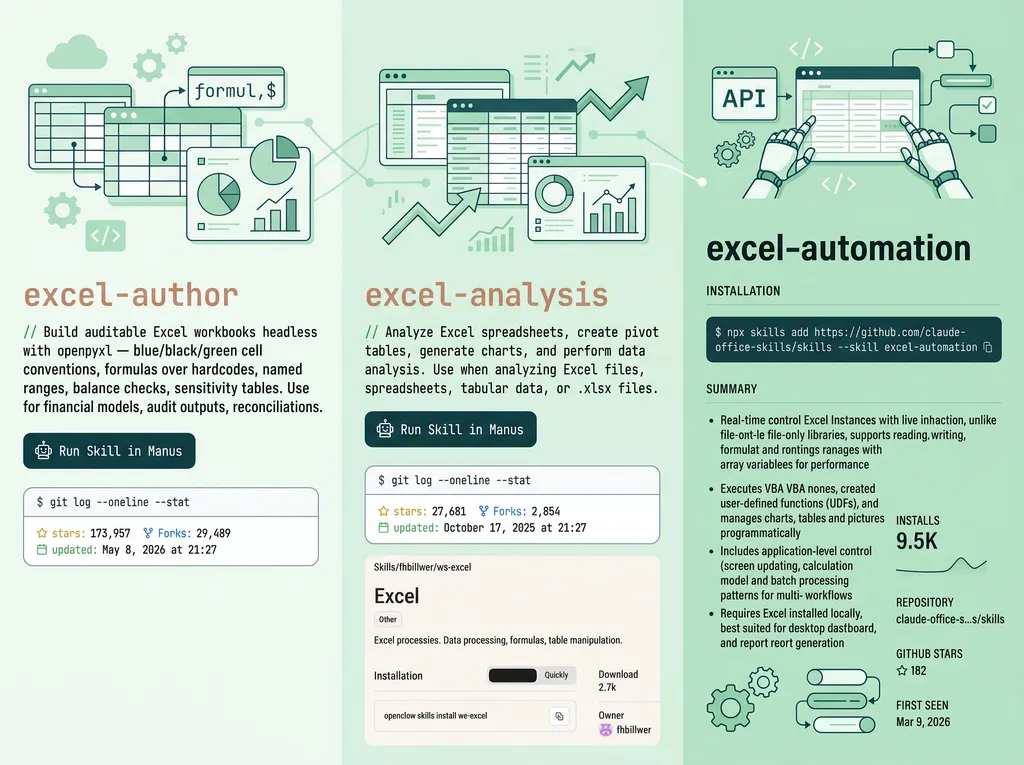
As AI-powered spreadsheet automation continues to evolve, a new generation of Excel-focused agent skills is emerging. Rather than acting as simple formula assistants, these tools are designed to automate entire workflows—from financial modeling and data analysis to workbook management and large-scale file processing.
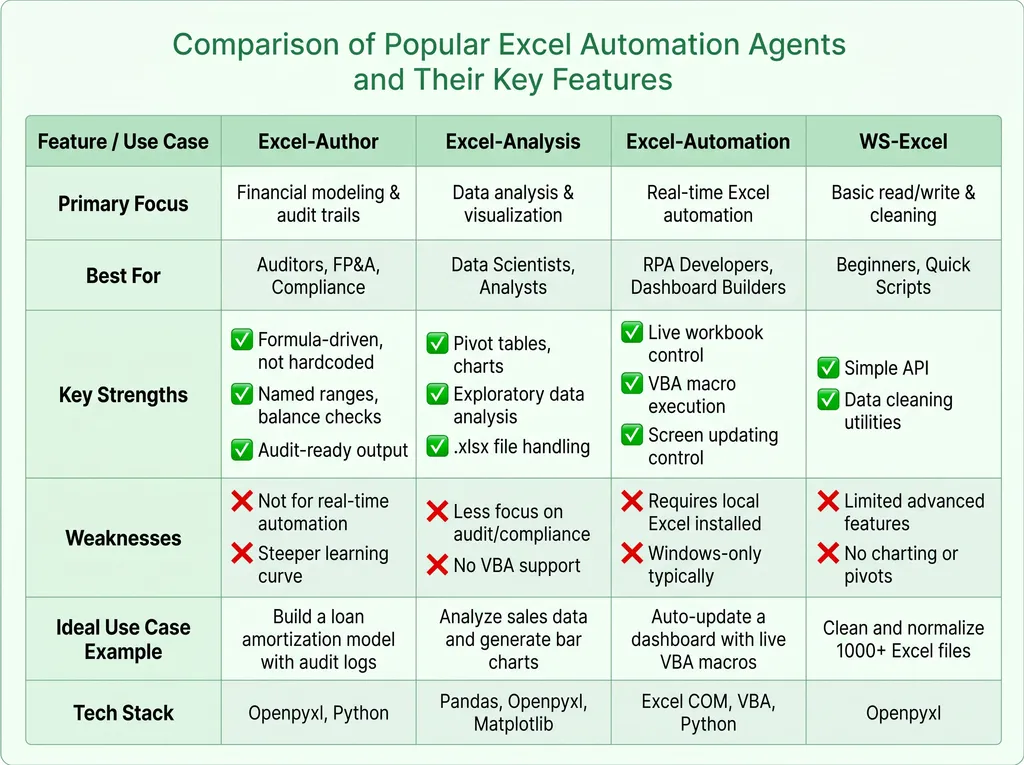
The table above showcases four key categories of Excel agents currently on the market. While there is some overlap in their capabilities, each is tailored to specific types of users and workflows:
- Audit & Compliance Focused: Some agents excel at building audit-ready financial models and supporting compliance-focused spreadsheet tasks, making them ideal for finance and accounting teams.
- Data Analysis & Visualization: Others specialize in transforming raw data into actionable insights through pivot tables, charts, and exploratory analysis, catering to analysts and data scientists.
- Advanced Automation: Certain automation agents can directly interact with live Excel workbooks, execute VBA macros, and update dashboards in real time, streamlining complex reporting workflows.
- Lightweight & Task-Oriented: At the simpler end of the spectrum, lightweight agents focus on rapid file manipulation, data cleaning, and bulk processing, all with minimal setup, perfect for operational efficiency and repetitive tasks.
What stands out is that the Excel agent ecosystem is becoming increasingly specialized. Instead of searching for a single "best" Excel AI, organizations are beginning to choose agents based on their specific workflows. A financial planning team may value audit trails and formula transparency, while a business analyst may prioritize visualization and reporting capabilities. Meanwhile, operations teams often benefit most from automation-focused agents that can eliminate repetitive manual updates altogether.
This shift reflects a broader trend in workplace AI: moving beyond generic assistants toward purpose-built agents designed to solve domain-specific problems. For Excel users, that means less time spent writing formulas, cleaning spreadsheets, or maintaining reports—and more time focused on decision-making.
The real question is no longer whether AI can help with Excel. It's which type of Excel agent is the right fit for your workflow.
What Makes This Different from Traditional Excel AI
After testing a variety of Excel AI tools, one difference became increasingly clear: most Excel assistants are designed to answer questions, while Open Claw's Excel Agent is designed to build systems.
Traditional Excel AI tools are often reactive. Users ask questions such as:
- "How do I write a VLOOKUP formula?"
- "Why is this SUMIF formula not working?"
- "How can I create a PivotTable?"
The AI then provides an answer, generates a formula, or explains an Excel function. While useful, the interaction typically ends there.
Open Claw's Excel Agent takes a fundamentally different approach.
Instead of solving isolated spreadsheet problems, it focuses on designing complete workflows that can be reused across real business scenarios. Throughout the testing process, the agent was able to move beyond formula generation and assist with tasks such as:
- automated reporting
- sales performance tracking
- dashboard creation
- regional business analysis
- anomaly detection
- operational monitoring
More importantly, the agent explains the logic behind each solution. Rather than hiding the spreadsheet mechanics, it exposes the formulas, calculations, and reporting structures that power the workflow. Users can understand how the system works, modify it, and adapt it to their own business requirements.
This distinction is important because most business users do not struggle with individual formulas—they struggle with building scalable spreadsheet processes.
As AI productivity tools continue to evolve, this workflow-first approach may prove far more valuable than simply generating formulas on demand.
Final Verdict
Excel agents are no longer experimental tools, they are rapidly becoming a practical layer of automation on top of traditional spreadsheet workflows.
The tools featured in this comparison demonstrate that the market is moving beyond simple formula generation. Today's Excel agents can analyze datasets, automate repetitive operations, generate reports, and even interact with live workbooks with minimal human intervention. As these capabilities continue to improve, the role of Excel users is shifting from manual spreadsheet operators to workflow supervisors and decision-makers.
That said, there is no universal "best" Excel agent. The right choice depends on your specific use case. Finance teams may prioritize auditability and model transparency, analysts may focus on data exploration and visualization, while operations teams often benefit most from automation-first solutions.
Where the Skill Excels
Based on the testing results, the Excel Agent achieved the following scores:
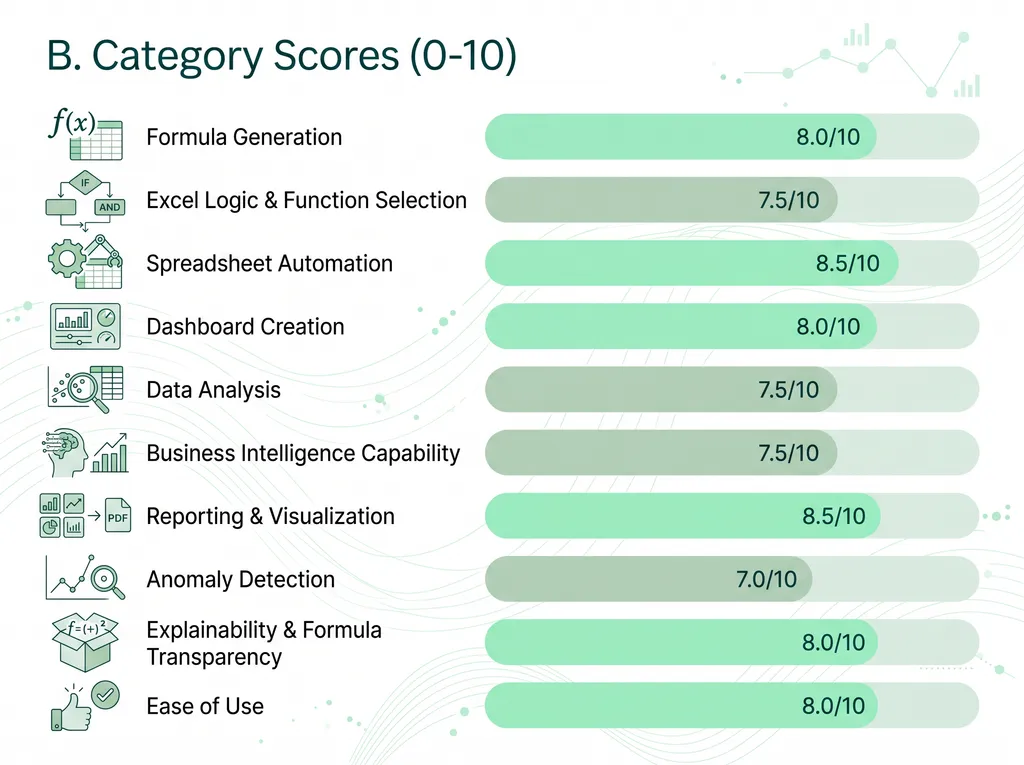
Overall Score: 7.9/10
The strongest aspect of the Excel Agent is its ability to automate repetitive spreadsheet workflows. Tasks that would normally require multiple formulas, PivotTables, conditional formatting rules, and manual report construction can be completed through structured AI-generated workflows.
The agent performs particularly well in:
- Spreadsheet automation
- Reporting and visualization
- Dashboard creation
- Formula transparency
- Operational reporting
Its explanations are also clear enough for intermediate Excel users to understand and modify the generated logic, making it useful not only as a productivity tool but also as a learning resource.
Areas for Improvement
The lower scores in Business Intelligence and Anomaly Detection highlight the current limitations of the skill.
While the agent can successfully create analytical frameworks and rule-based monitoring systems, it does not yet offer the depth of dedicated BI platforms or advanced data science tools. Complex forecasting, predictive analytics, and sophisticated anomaly detection models still require specialized software beyond Excel.
In other words, the skill is excellent at organizing and analyzing spreadsheet data, but it is not a replacement for enterprise analytics solutions.
Who Should Use This xls Agent Skill?
These Excel Agent skills are particularly well suited for:
- Sales operations teams
- Business analysts
- Finance professionals
- Operations managers
- Excel power users
- Small and medium-sized businesses without dedicated BI tools
If your daily work involves building reports, cleaning datasets, tracking KPIs, or maintaining dashboards, the skill can significantly reduce manual effort while improving reporting consistency.
The future of Excel isn't about doing more work in spreadsheets. It's about letting spreadsheets do more work for you.
By leveraging AI-powered Excel agents, professionals can focus on insights rather than manual tasks. The tools you choose today will shape how efficiently you manage, analyze, and act on data tomorrow.

Related Articles

Find the top PPT agent skills featuring specialized AI capabilities for diverse business, academic, and creative workflows.

Discover the best copywriting agent skills for persuasive content creation, audience targeting, brand voice consistency, and high-converting marketing campaigns.